
The official closing bell no longer marks the end of trading opportunities for active investors. Institutional earnings reports, executive guidance changes, and unexpected macroeconomic updates — they routinely trigger major price moves long after primary stock exchanges close their doors.
Key Takeaways
- Modern multi-asset platforms allow active traders to monitor extended-hours price action with complete technical clarity.
- Filtering extended-session stocks by relative volume and percentage change eliminates non-actionable price noise.
- Customizing chart views for extended sessions reveals hidden support and resistance levels that standard daytime charts miss completely.
Tracking after-hours stock movements requires the right screening tools and clean chart setups. Here is how to spot real overnight opportunities, filter out noise, and prepare for the market open.
1. Configuring Extended-Hours Charting Displays
Analyzing price action outside regular market hours requires configuring your charting interface correctly. Standard daily candlestick charts aggregate price data based purely on regular trading hours, completely hiding the price discovery that takes place overnight.
To view extended trading sessions, traders must activate the Extended Hours toggle on intraday price charts. This setting applies visual shading to pre-market and post-market sessions — making it easy to separate regular hours from extended trading periods.
Setting up distinct background colors for extended sessions will give you immediate visual context when reviewing price action. Understanding price levels established during overnight sessions is important because they frequently act as major support or resistance during subsequent regular trading days.
By maintaining a complete view of the after hours stock market, traders can map out key overnight highs and lows that standard charts hide. You will get a superior technical foundation for planning regular session trades.
2. Constructing Automated Stock Screeners
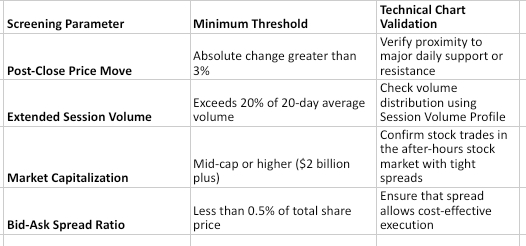
Manually searching through thousands of stocks after the bell is inefficient and prone to missed opportunities. But using an automated stock screener can streamline your research, quickly highlighting stocks experiencing unusual volatility or heavy volume outside regular hours. Effective screeners will let you apply customized filters — minimum market capitalization, average daily volume, and post-close percentage gains or losses.
Filtering for stocks with substantial post-close trading volume ensures that you focus exclusively on companies with active institutional backing. When setting up custom screener rules, setting a volume threshold relative to a stock's 20-day average volume helps eliminate illiquid noise.
Tracking top after-hours movers through automated screeners allows traders to build a focused watch list for the next morning — zeroing in on stocks with genuine momentum driven by quarterly earnings or major news.
3. Analyzing Volume Profile and Price Discovery
Price movement during extended sessions must always be interpreted alongside volume distribution. Because overall market liquidity is lower outside regular hours, small orders can push prices to extreme levels. Applying a Session Volume Profile indicator to extended-hours charts shows exactly where trading volume accumulated during the post-close session.
Finding the Point of Control, which marks the price level with the highest traded volume during the extended session, reveals where institutional buyers and sellers agreed on fair value. If price moves significantly higher on light volume but fails to build volume at upper levels, the move may lack conviction. Conversely, heavy volume accumulation near session highs confirms strong institutional buying.
Watching volume distribution across top after-hours movers helps traders separate sustainable breakouts from temporary liquidity spikes.
4. Extended-Hours Screening and Technical Matrix
5. Translating Off-Hours Analysis into Regular Session Execution
Preparing for the regular session open requires converting overnight chart analysis into clear execution plans. Once extended-session support and resistance zones are established, traders should set automated price alerts on key levels. Automated alerts remove the need to constantly watch quotes — notifying you immediately when price approaches critical breakout or breakdown points.
When the regular session opens, observing how price reacts to extended-hours levels provides valuable market clues. If a stock opens above its extended-session high and holds that level on heavy volume, buyers remain in firm control. If price quickly falls back into the previous day's range, the overnight move has likely failed. Using structured charting tools enables traders to enter the regular session with clear, pre-planned execution scenarios.
Optimizing Your Off-Hours Workflow
Navigating extended trading sessions successfully requires a structured mix of automated screening tools and disciplined technical chart analysis. By customizing chart displays, applying volume profile indicators, and using systematic screener filters, you can uncover high-probability opportunities hidden from standard daytime charts.