

Vertically integrated manufacturing solutions provider Mayville Engineering Company (NYSE:MEC) reported Q3 CY2025 results beating Wall Street’s revenue expectations, with sales up 6.6% year on year to $144.3 million. The company’s full-year revenue guidance of $545 million at the midpoint came in 1.1% above analysts’ estimates. Its non-GAAP profit of $0.10 per share was significantly above analysts’ consensus estimates.
Is now the time to buy Mayville Engineering? Find out by accessing our full research report, it’s free for active Edge members.
Mayville Engineering (MEC) Q3 CY2025 Highlights:
- Revenue: $144.3 million vs analyst estimates of $140.4 million (6.6% year-on-year growth, 2.8% beat)
- Adjusted EPS: $0.10 vs analyst estimates of $0.01 (significant beat)
- Adjusted EBITDA: $14.1 million vs analyst estimates of $13.62 million (9.8% margin, 3.5% beat)
- The company reconfirmed its revenue guidance for the full year of $545 million at the midpoint
- EBITDA guidance for the full year is $52 million at the midpoint, above analyst estimates of $50.98 million
- Operating Margin: 0%, down from 4.2% in the same quarter last year
- Free Cash Flow was -$1.15 million, down from $15.07 million in the same quarter last year
- Market Capitalization: $358.8 million
Company Overview
Originally founded solely on tool and die manufacturing, Mayville Engineering Company (NYSE:MEC) specializes in metal fabrication, tube bending, and welding to be used in various industries.
Revenue Growth
A company’s long-term performance is an indicator of its overall quality. Any business can have short-term success, but a top-tier one grows for years. Luckily, Mayville Engineering’s sales grew at a decent 7.9% compounded annual growth rate over the last five years. Its growth was slightly above the average industrials company and shows its offerings resonate with customers.
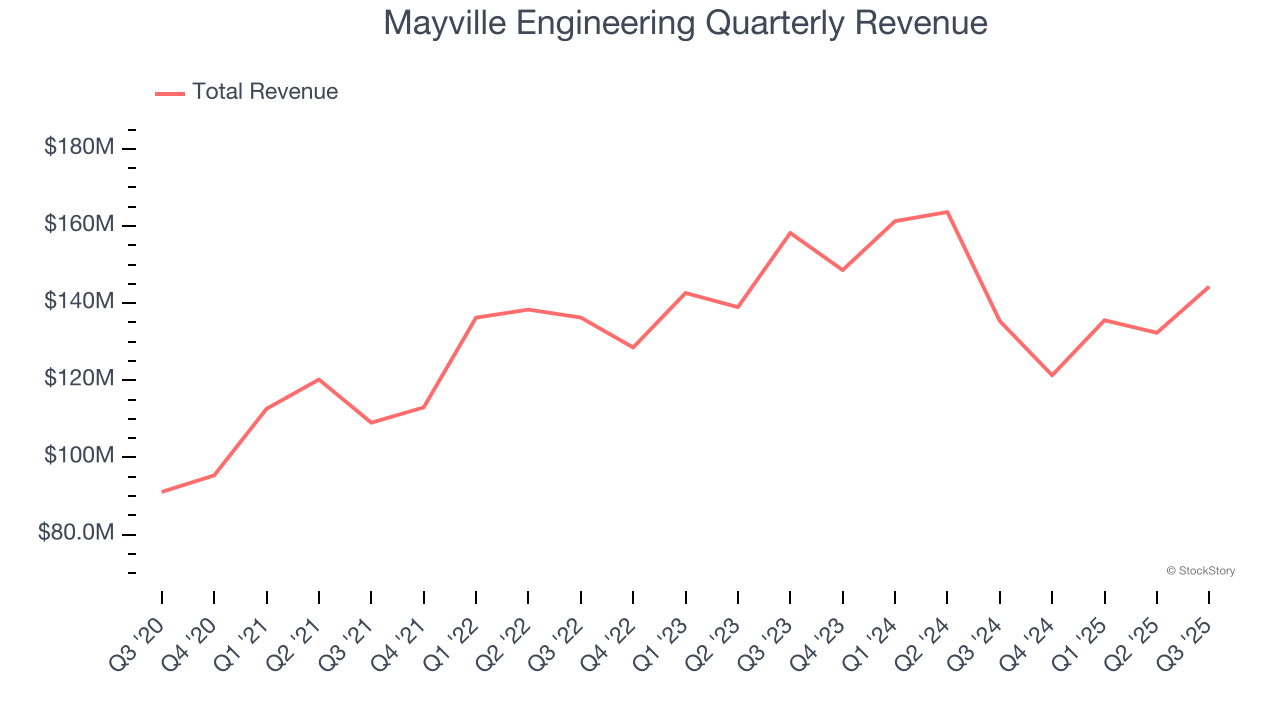
We at StockStory place the most emphasis on long-term growth, but within industrials, a half-decade historical view may miss cycles, industry trends, or a company capitalizing on catalysts such as a new contract win or a successful product line. Mayville Engineering’s recent performance marks a sharp pivot from its five-year trend as its revenue has shown annualized declines of 3.1% over the last two years. 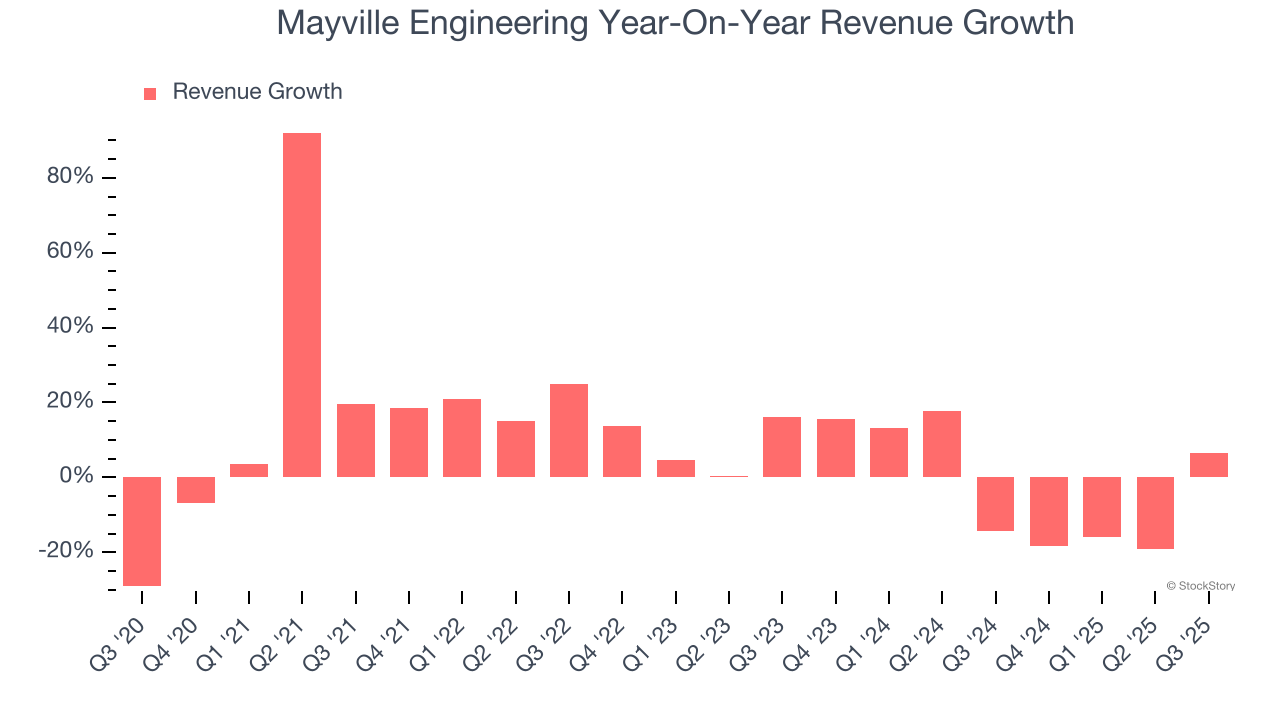
We can dig further into the company’s revenue dynamics by analyzing its most important segments, Commercial Vehicle and Construction & Access, which are 27.2% and 15.3% of revenue. Over the last two years, Mayville Engineering’s Commercial Vehicle revenue (exhaust, engine components, fuel systems) averaged 8.7% year-on-year declines while its Construction & Access revenue (fenders, hoods, frames for heavy machinery) averaged 11.7% declines. 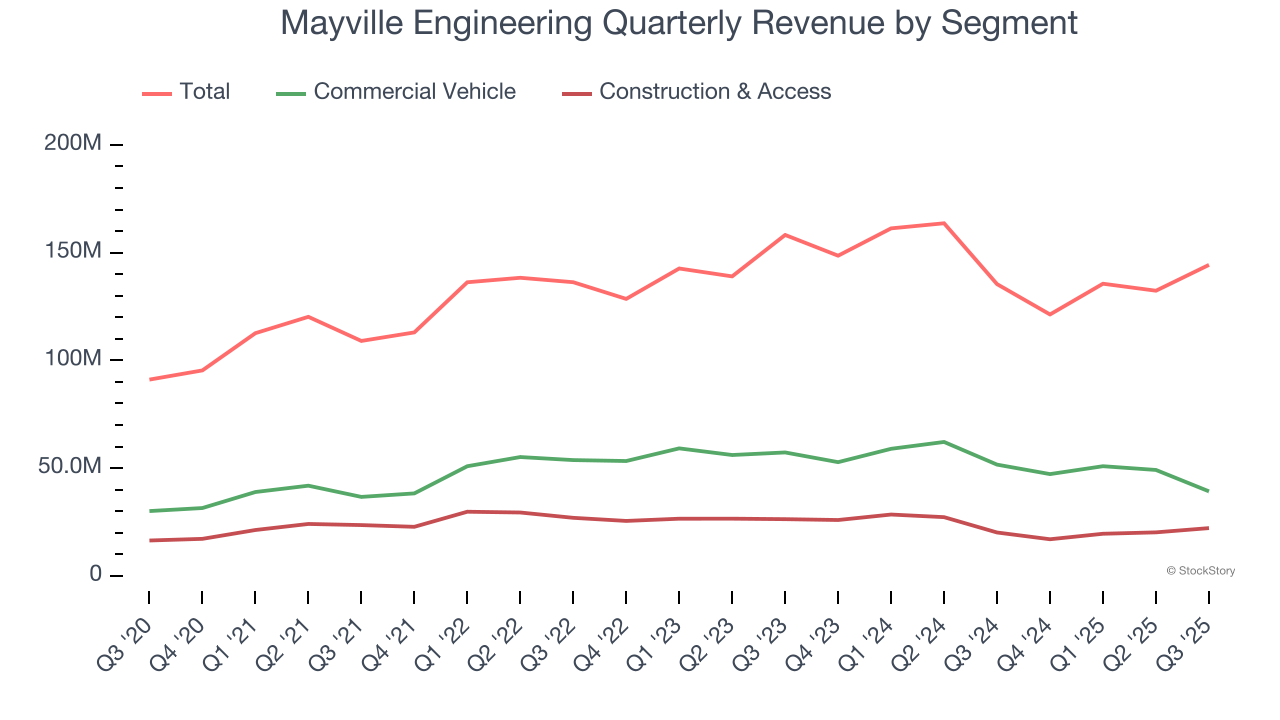
This quarter, Mayville Engineering reported year-on-year revenue growth of 6.6%, and its $144.3 million of revenue exceeded Wall Street’s estimates by 2.8%.
Looking ahead, sell-side analysts expect revenue to grow 11.2% over the next 12 months, an improvement versus the last two years. This projection is admirable and implies its newer products and services will fuel better top-line performance.
While Wall Street chases Nvidia at all-time highs, an under-the-radar semiconductor supplier is dominating a critical AI component these giants can’t build without. Click here to access our free report one of our favorites growth stories.
Operating Margin
Operating margin is a key measure of profitability. Think of it as net income - the bottom line - excluding the impact of taxes and interest on debt, which are less connected to business fundamentals.
Mayville Engineering was profitable over the last five years but held back by its large cost base. Its average operating margin of 3.2% was weak for an industrials business. This result isn’t too surprising given its low gross margin as a starting point.
On the plus side, Mayville Engineering’s operating margin rose by 2.3 percentage points over the last five years, as its sales growth gave it operating leverage.
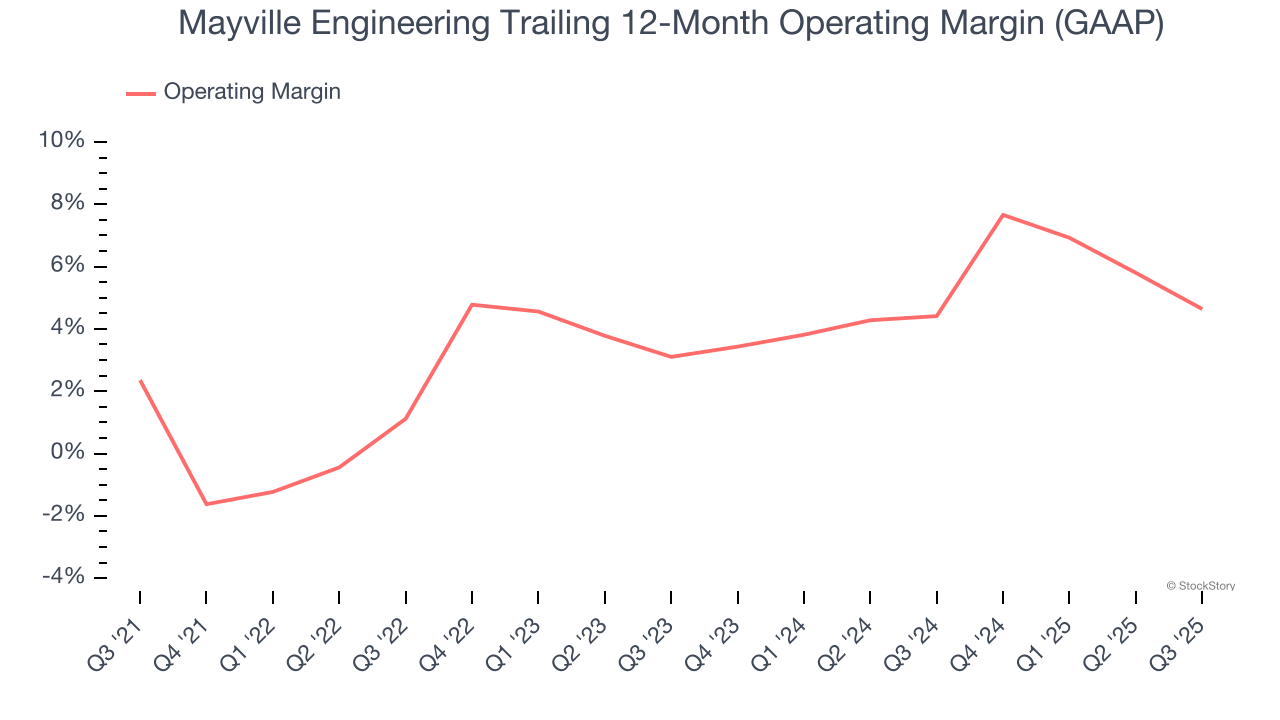
This quarter, Mayville Engineering’s breakeven margin was down 4.2 percentage points year on year. Since Mayville Engineering’s operating margin decreased more than its gross margin, we can assume it was less efficient because expenses such as marketing, R&D, and administrative overhead increased.
Earnings Per Share
Revenue trends explain a company’s historical growth, but the long-term change in earnings per share (EPS) points to the profitability of that growth – for example, a company could inflate its sales through excessive spending on advertising and promotions.
Mayville Engineering’s full-year EPS flipped from negative to positive over the last five years. This is encouraging and shows it’s at a critical moment in its life.
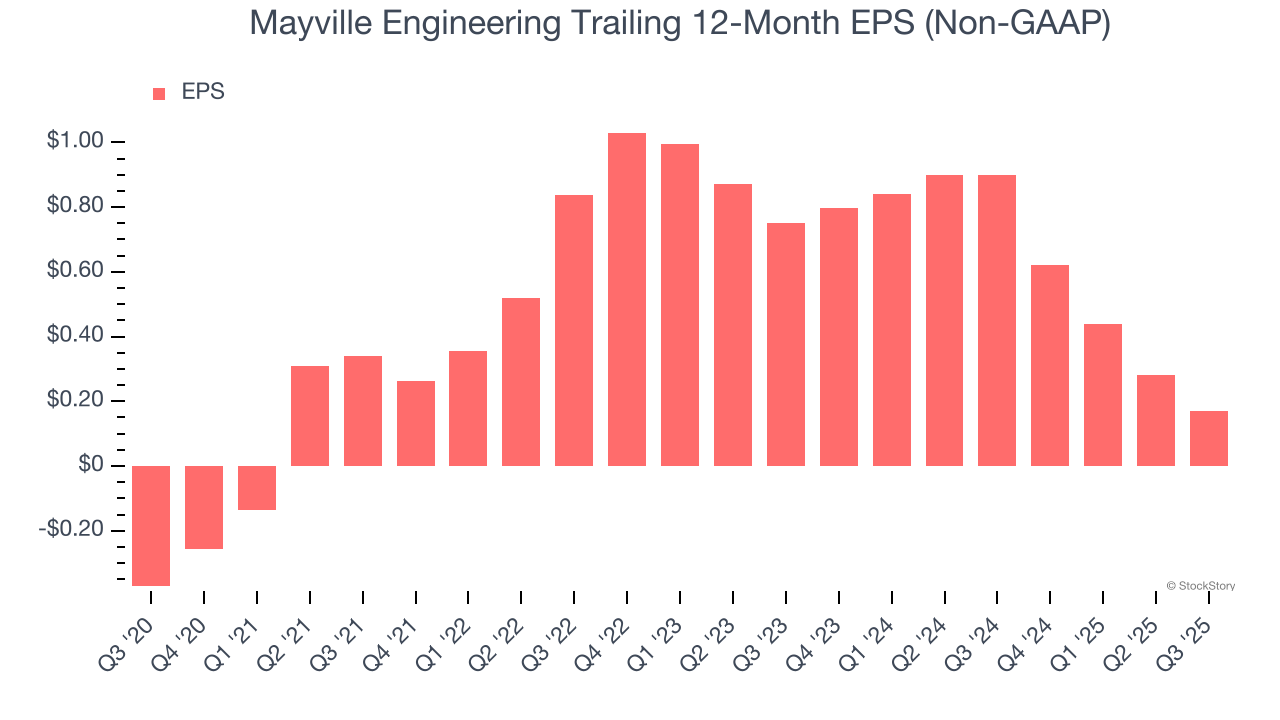
Like with revenue, we analyze EPS over a shorter period to see if we are missing a change in the business.
Sadly for Mayville Engineering, its EPS declined by more than its revenue over the last two years, dropping 52.4%. This tells us the company struggled to adjust to shrinking demand.
Diving into the nuances of Mayville Engineering’s earnings can give us a better understanding of its performance. Mayville Engineering’s operating margin has declined over the last two years. This was the most relevant factor (aside from the revenue impact) behind its lower earnings; interest expenses and taxes can also affect EPS but don’t tell us as much about a company’s fundamentals.
In Q3, Mayville Engineering reported adjusted EPS of $0.10, down from $0.21 in the same quarter last year. Despite falling year on year, this print easily cleared analysts’ estimates. Over the next 12 months, Wall Street expects Mayville Engineering’s full-year EPS of $0.17 to grow 38.5%.
Key Takeaways from Mayville Engineering’s Q3 Results
It was good to see Mayville Engineering beat analysts’ EPS expectations this quarter. We were also glad its Construction & Access revenue topped Wall Street’s estimates. On the other hand, its Commercial Vehicle revenue missed. Zooming out, we think this was a good print with some key areas of upside. Investors were likely hoping for more, and shares traded down 3% to $17.49 immediately after reporting.
So do we think Mayville Engineering is an attractive buy at the current price? What happened in the latest quarter matters, but not as much as longer-term business quality and valuation, when deciding whether to invest in this stock. We cover that in our actionable full research report which you can read here, it’s free for active Edge members.